
Marlin Business Services reported Q3/20 net income of $2.7 million compared with net loss of $5.9 million in the prior quarter and net income of $7.4 million in Q3/19.
“Given the significant challenges we faced in the first half of 2020 arising from the COVID-19 pandemic, I am very pleased with the resiliency of our business and our return to profitability in the third quarter,” Jeffrey A. Hilzinger, president and CEO of Marlin, said. “Due to significantly improving portfolio performance and outlook, coupled with the benefits from the cost reductions we implemented earlier in the year, we generated net income of $2.7 million, or $0.23 per diluted share, and adjusted net income of $3.2 million, or $0.27 per diluted share. Portfolio performance improved throughout the third quarter and has continued into the fourth quarter. Given these trends, the assumptions underlying our loss reserves have been more informed by our actual experience, and our capital position remains strong as we ended the quarter with increased reserve coverage, a total risk-based capital ratio of 22.49%% and book value of $15.23 per share.”
Results of Operations
Marlin reported total sourced origination volume for the third quarter of $68.5 million, which was down 66% from a year ago. Direct origination volume of $8.4 million in the third quarter was down 79.8% from $41.6 million in Q3/19. Indirect origination volume in Q3/20 was $58.8 million, down 57.9% from $139.5 million in Q3/19. Assets originated for sale in the third quarter were not significant compared with $18.2 million in the third quarter last year.
“Third quarter total sourced origination volume of $68.5 million was impacted by a number of factors, including the disruption caused by the restructuring of our front-office operations, reduced customer demand and lower approval rates from tightened underwriting standards,” Hilzinger said. “As we look ahead, we believe that our strong balance sheet and the investments we are making in our digital origination platform put us in a great position to best serve our partners and customers and to take full advantage of the increased demand for small business financing as the economy recovers.”
Referral volume totaled $1.3 million, down from $2.4 million in the third quarter last year. Net investment in leases and loans was $847 million, down 18.2% from third quarter last year, while total managed assets stood at approximately $1.2 billion, down 14.7% from the third quarter last year.
Net interest and fee margin as a percentage of average finance receivables was 8.87% for the third quarter, up 19 basis points from Q2/20 and down 68 basis points from a year ago.
According to Marlin, the sequential quarter increase was driven primarily by an increase in new origination loan and lease yields, higher fee income and a decrease in interest expense resulting from lower deposit rates. The year-over-year decrease in margin percentage was primarily related to the decrease in new origination loan and lease yields, the change in the presentation of residual income driven by the adoption of CECL, and portfolio mix, partially offset by a decrease in interest expense resulting from lower deposit rates.
During 2019 and prior periods, Marlin presented residual income in fee income; however, beginning in Q1/20, Marlin began including residual income in the future cash flows used to assess credit losses and therefore this activity is reflected in the allowance for credit losses. The company’s interest expense as a percent of average total finance receivables was 203 basis points in Q3/20 compared with 222 basis points for the prior quarter and 250 basis points for Q3/19, resulting from lower rates and a shift in mix as higher rate long-term debt pays down.
On an absolute basis, net interest and fee income was $20.5 million for Q3/20 compared with $25 million in the third quarter last year.
The provision for credit losses was $7.2 million in Q3/20 compared with $18.8 million in Q2/20 and $7.7 million in Q3/19. According to Marlin, in Q3/20, net change in expected impacts from COVID-19 on the portfolio and estimated credit losses was not significant compared with the prior quarters of this year.
Non-interest income was $4.2 million for Q3/20 compared with $3.8 million in the prior quarter and $10.4 million in the prior year period. The sequential increase in non-interest income was primarily due to the increase in reserves for property tax receivables in the prior quarter, according to Marlin, which noted that the year-over-year decrease in non-interest income is primarily due to a $6.4 million decrease in gains from the sale of assets.
Non-interest expense was $14.2 million for Q3/20 compared with $13.5 million in the prior quarter and $17 million in Q3/19. Marlin said the sequential quarter increase was primarily due to an intangible assets impairment charge of $1 million in the third quarter associated with the company’s past acquisition of Fleet Financing Resources (FFR) as well as higher salaries and benefits expense primarily driven by an adjustment in the second quarter to reduce incentive compensation probable payout. This was partially offset by a decrease in general and administrative expenses due to a $1.4 million reduction in the estimated liability for contingent consideration related to the FFR acquisition, according to the company. In addition, Marlin said the year-over-year decrease was primarily due to a $2.4 million reduction in salaries and benefits expense due to lower commission on lower origination volumes and lower incentive compensation driven by company performance along with the aforementioned offsetting amounts related to FFR that only impacted 2020.
The company’s efficiency ratio for the third quarter was 57.6% compared with 48.0% in the third quarter last year. Excluding the impact of certain non-GAAP adjustments, the company’s efficiency ratio on an adjusted basis for the third quarter was 53.4% compared with 46.1% in Q3/19.
Marlin recorded a $0.5 million tax expense in the third quarter, representing an effective tax rate of 16.1%. According to Marlin, the lower effective tax rate during the quarter was due to the partial recapture of previously capped income tax benefit. In Q2/20, the company recorded a $1.4 million tax benefit representing an effective tax rate of 18.9% due to a $0.6 million discrete reduction in the income tax benefit resulting from interim tax financial reporting requirements, and in Q3/199, the company recorded $3.3 million of tax expense, representing an effective tax rate of 30.6%. Marlin said the higher effective tax rate in the third quarter of 2019 reflects changes in state statutory rates and related revaluation of deferred tax as well as the establishment of a valuation allowance against certain net operating loss carryforwards that are not expected to be utilized.
Portfolio Performance
Allowance for credit losses as a percentage of total finance receivables was 6.75% at Sept. 30, 2020, compared with 6.53% at June 30, 2020. In addition, under the incurred loss allowance model in 2019, the percentage was 1.86% at Sept. 30, 2019.
For the three months ended Sept. 30, 2020, Marlin recorded a $7.2 million provision for credit losses, which was $0.5 million lower than the $7.7 million provision recognized for the three months ended Sept. 30, 2019, and $11.6 million lower than the $18.8 million recognized in Q2/20. Marlin also said that in Q3/20, its net change in expected impacts from COVID-19 on its portfolio and estimated credit losses was not significant compared with the prior quarters of this year.
As a result of the ongoing impact from COVID-19, through the end of the third quarter, Marlin has completed more than 5,200 loan and lease restructure requests from customers who have been impacted by the pandemic. As of Sept. 30, 2020, the company had $129.9 million total receivables that were part of this program. This equated to 14.3% of total net investment and $117.6 million (13.4%) of equipment finance and $12.2 million (46.1%) of working capital. In the third quarter, Marlin processed new modifications for 406 contracts, or $9.4 million net investment, and extended the modification period for 319 contracts with $16.4 million net investment.
Through the end of the third quarter, Marlin reported $109.1 million (84%) of modified contracts are out of the deferral period, and the current deferral period will expire for most of the remaining modified contracts before Dec. 31, 2020. Marlin is no longer taking new applications for modifications.
The following table outlines the delinquency status of the company’s portfolio as of Sept. 30, 2020, including information on restructured contracts in deferral and restructured contracts that have resumed scheduled payment.
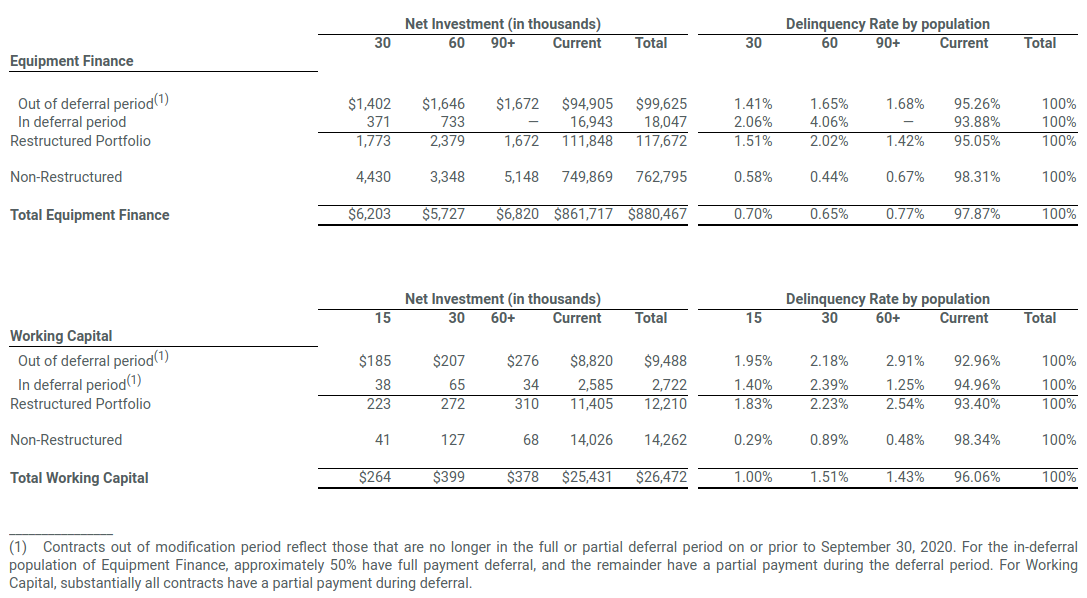
Equipment finance receivables more than 30 days delinquent were 213 basis points as of Sept. 30, 2020, down 177 basis points from June 30, 2020, and up 86 basis points from Sept. 30, 2019. Working capital receivables more than 15 days delinquent were 393 basis points as of Sept. 30, 2020, down 45 basis points from June 30, 2020, and up 204 basis points from Sept. 30, 2019. Annualized third quarter total net charge-offs were 4.54% of average total finance receivables versus 3.47% in Q2/20 and 1.99% a year ago.
Portfolio Concentration
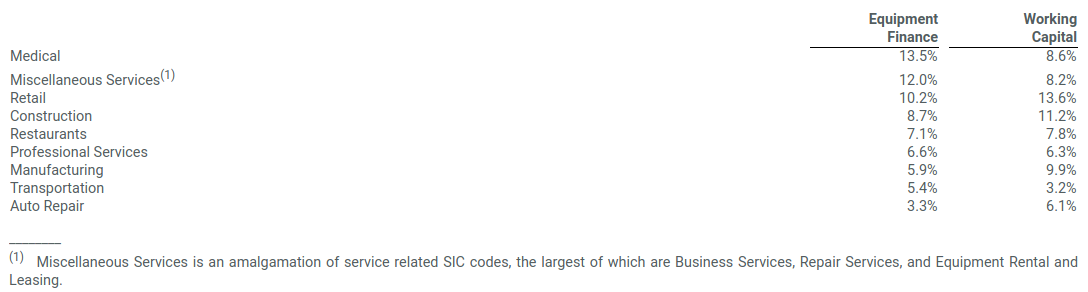
In terms of portfolio concentration, the following table reflects Marlin’s portfolio concentrations by industry where net investment is in excess of 5% of the total portfolio as of Sept. 30, 2020:
Capital and Liquidity
As of Sept. 30, 2020, Marlin had $195.1 million of cash and cash equivalents, an increase of $72 million from Dec. 31, 2019. As of Sept. 30, 2020, the company had additional available liquidity of $84.3 million from lines of credit with financial institutions and the Federal Reserve discount window. There were no borrowings made on these additional sources of liquidity as of Sept. 30, 2020, or subsequently.
As of Sept. 30, 2020, Marlin’s consolidated equity to assets ratio was 16.49 %. This compares with 15.13 % and 16.74 %, in the prior quarter and year-ago quarter, respectively. The company’s total risk-based capital ratio was 22.49% as of Sept. 30, 2020, which was 14.49% above the company’s minimum regulatory requirement.
Like this story? Begin each business day with news you need to know! Click here to register now for our FREE Daily E-News Broadcast and start YOUR day informed!

Terry Mulreany
Subscriptions: 800 708 9373 x130
[email protected]
Susie Angelucci
Advertising: 484.459.3016
[email protected]

Visit our sister website for news, information, exclusive articles,
deal tables and more on the asset-based lending, factoring,
and restructuring industries.
www.abfjournal.com