
The surge in PC demand from earlier this year continued through Q2/21 despite global component shortages and logistics issues, according to preliminary results from International Data Corporation’s Worldwide Quarterly Personal Computing Device Tracker.
Worldwide shipments of traditional PCs, including desktops, notebooks and workstations, reached 83.6 million units in Q2/21, up 13.2% from Q2/20. Desktop growth outpaced notebook growth in the quarter, as elevated demand for PCs combined with shortages that greatly impacted the supply of notebooks.
“The PC market’s hot streak continued to drive heavy investments from the supply side, including the entry of new vendors as well as additional spend from underdogs,” Jitesh Ubrani, research manager for IDC’s mobile and consumer device trackers, said. “And while the top five continue to drive volume, the smaller vendors have helped drive growth by offering unique features or niche designs.”
Although annual growth remains quite high, it has begun to taper off, as the 13% growth rate in Q2/21 is far lower than the 55.9% growth rate from Q1/21 and the 25.8% growth rate in Q4/20.
“The market faces mixed signals as far as demand is concerned,” Neha Mahajan, senior research analyst with IDC’s devices and displays group, said. “With businesses opening back up, demand potential in the commercial segment appears promising. However, there are also early indicators of consumer demand slowing down as people shift spending priorities after nearly a year of aggressive PC buying.”
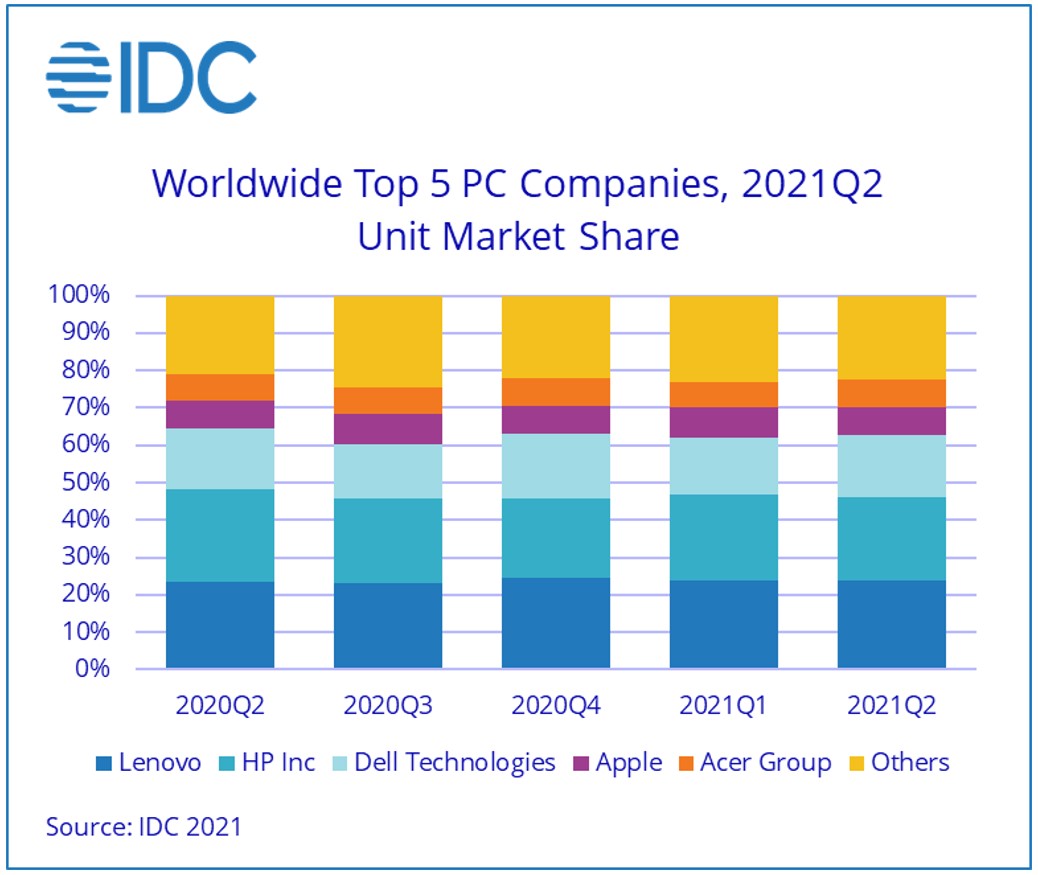
| Top Five Companies, Worldwide Traditional PC Shipments, Market Share and Year-Over-Year Growth, Q2/21 (Preliminary results, shipments are in thousands of units) | |||||
| Company | Q2/21 Shipments | Q2/21 Market Share | Q2/20 Shipments | Q2/20 Market Share | Q2/21/Q2/20 Growth |
| 1. Lenovo | 20,005 | 23.9% | 17,407 | 23.6% | 14.9% |
| 2. HP | 18,594 | 22.2% | 18,104 | 24.5% | 2.7% |
| 3. Dell Technologies | 13,976 | 16.7% | 12,010 | 16.3% | 16.4% |
| 4T. Apple* | 6,156 | 7.4% | 5,630 | 7.6% | 9.4% |
| 4T. Acer Group* | 6,088 | 7.3% | 5,177 | 7% | 17.6% |
| Others | 18,795 | 22.5% | 15,551 | 21% | 20.9% |
| Total | 83,614 | 100% | 73,879 | 100% | 13.2% |
| Source: IDC Quarterly Personal Computing Device Tracker, July 12, 2021 | |||||
* IDC declares a statistical tie in the worldwide traditional PC market when there is a difference of one tenth of one percent (0.1%) or less in the shipment shares among two or more vendors.
Some IDC estimates for this report were made prior to financial earnings reports. Data for all companies are reported for calendar periods. Shipments include shipments to distribution channels or end users. OEM sales are counted under the company/brand under which they are sold.
For this report, traditional PCs include desktops, notebooks and workstations and do not include tablets or x86 servers.
Like this story? Begin each business day with news you need to know! Click here to register now for our FREE Daily E-News Broadcast and start YOUR day informed!

Terry Mulreany
Subscriptions: 800 708 9373 x130
[email protected]
Susie Angelucci
Advertising: 484.459.3016
[email protected]

Visit our sister website for news, information, exclusive articles,
deal tables and more on the asset-based lending, factoring,
and restructuring industries.
www.abfjournal.com